

Commentary
Q4 Streaming Hours Up 58% YoY, Social's Importance Grows In News, Sports Views
- by Karlene Lukovitz @KLmarketdaily, February 4, 2020
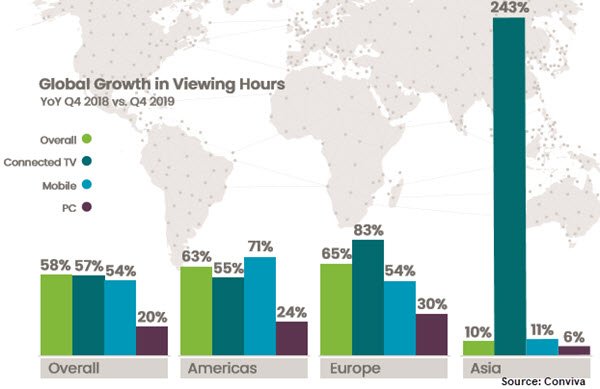
Streamed viewing hours rose by 63% in the Americas and 58% globally in 2019’s fourth quarter compared to the year-ago quarter, according to the latest “State of Streaming” report from Conviva.
Minutes-per-play averaged 19.59 globally and 20.61 in the Americas.
Europe’s streaming hours rose 65% in the quarter versus fourth-quarter 2018. And while Asia’s streaming hours rose just 10% and CTV accounts for just 2% of viewing hours in Asia, it saw 243% year-over-year growth (versus just 11% and 6% growth for mobile and PC devices, respectively).
Nearly a quarter of all streaming time — at 24% — is spent on a mobile device, and Google’s Android phones have a 60% share of mobile devices used (up 47% year-over-year).
Apple’s iPhone and iPad have 26% and 14% shares, respectively. That’s an 84% increase for the iPhone.
Social Video Core to News, Sports Publishers
News organizations created 23% more videos on average across all social platforms in 2019.
Video length spiked 151% and average views per video for news organizations jumped 125%.
In the fourth quarter versus the third quarter, they posted 62% more video on Instagram, 14% more on YouTube, 12% more on Facebook, and 5% more on Twitter.
Average views per video for news organizations leaped 125%, likely due to the impeachment of President Donald Trump, the upcoming U.S. Democratic primaries, and the U.K. Brexit scenario.
Facebook has become particularly important, growing from a 44% share of all video views for major news organizations in fourth-quarter 2018 to a dominant 66% in fourth-quarter 2019. On Facebook, total posts and total videos from news organizations grew 21% and 12% respectively, while video length spiked 151% year-over-year.
In the fourth quarter, news publishers posted 28% more live videos on average on Facebook. In the fourth quarter, that social platform saw a 125% increase in average views per news video versus fourth-quarter 2018.
Overall, Facebook accounted for nearly 60% of all video views for major news organizations on social media in 2019.
Meanwhile, professional sports found a balance on social: down 9% in number of videos posted in fourth-quarter 2019 versus the year-ago quarter, but capturing a cross-platform increase of 33% in average views per video and 40% in average engagements per video.
Sports organizations saw the largest increase of average engagements per video in the quarter, growing 50% on Instagram and 47% on YouTube.
Instagram drove the most views for pro teams during 2019, driving 46% of their total views.
Mixed News on the Ad Experience Front
However, as usual, there was mixed news on the advertising experience front.
Globally, the average length of time a viewer had to wait for an ad to start was 2.27 seconds in the fourth quarter — nearly double the 1.14 average seconds in third-quarter 2019, the video analytics and optimization firm reports.
As a result, the numbers of viewers exiting before ads begin surged by 49% between the two quarters.
Furthermore, ad buffering increased by 48% quarter-over-quarter.
In somewhat positive news, streaming ad attempts that failed to play as intended decreased from 39.6% in the third quarter to 36.5% in the fourth quarter.
Ad start failures also improved, from 35.7% in the third quarter to 30.8% in the fourth quarter.
Advertisers are also shortening their ads, with average time down from 38 seconds in the third quarter to 26.6 seconds in the fourth quarter.
The Americas experienced the lowest rate of video start failures (0.51%), the lowest rate of buffering (0.31%) and the best bitrate or picture quality (5.94 Mbps).
Roku, Fire TV Improve Ad Experience
Roku, which maintained a 43% of all connected TV viewing time in the fourth quarter, markedly improved its viewer experience during 2019, according to the report.
In the fourth quarter compared to the third quarter, Roku reduced video start failures by 56%, reduced video start times by 12%, reduced buffering by 34%, and improved bitrate/picture quality by 25%.
Fire TV — the second-largest player in the device category, with 18% of the CTV market — reduced video start failures by 15% and buffering by 9% in the fourth quarter versus the third quarter. However, Fire’s video start times rose 15% as compared with fourth-quarter 2018.
Apple TV, which has 9% of the CTV market, still leads with the fastest start time, but saw increases in both video start times and video start failures, up by 25% and 19% respectively.
“The companies that win the streaming wars will be those able to offer viewers a fast, clear, reliable experience regardless of where in the world they live, or what device they use,” underscored Conviva CEO Bill Demas.


Karlene Lukovitz is editor of MediaPost's "Digital News Daily" and writes the weekly "Video Insider" and "Advanced TV Insider" columns. You can reach her at karlene@mediapost.com.